Install
https://www.youtube.com/watch?v=CUDt8zJYAoc
How to use
https://www.youtube.com/watch?v=L_XXPHafNQQ
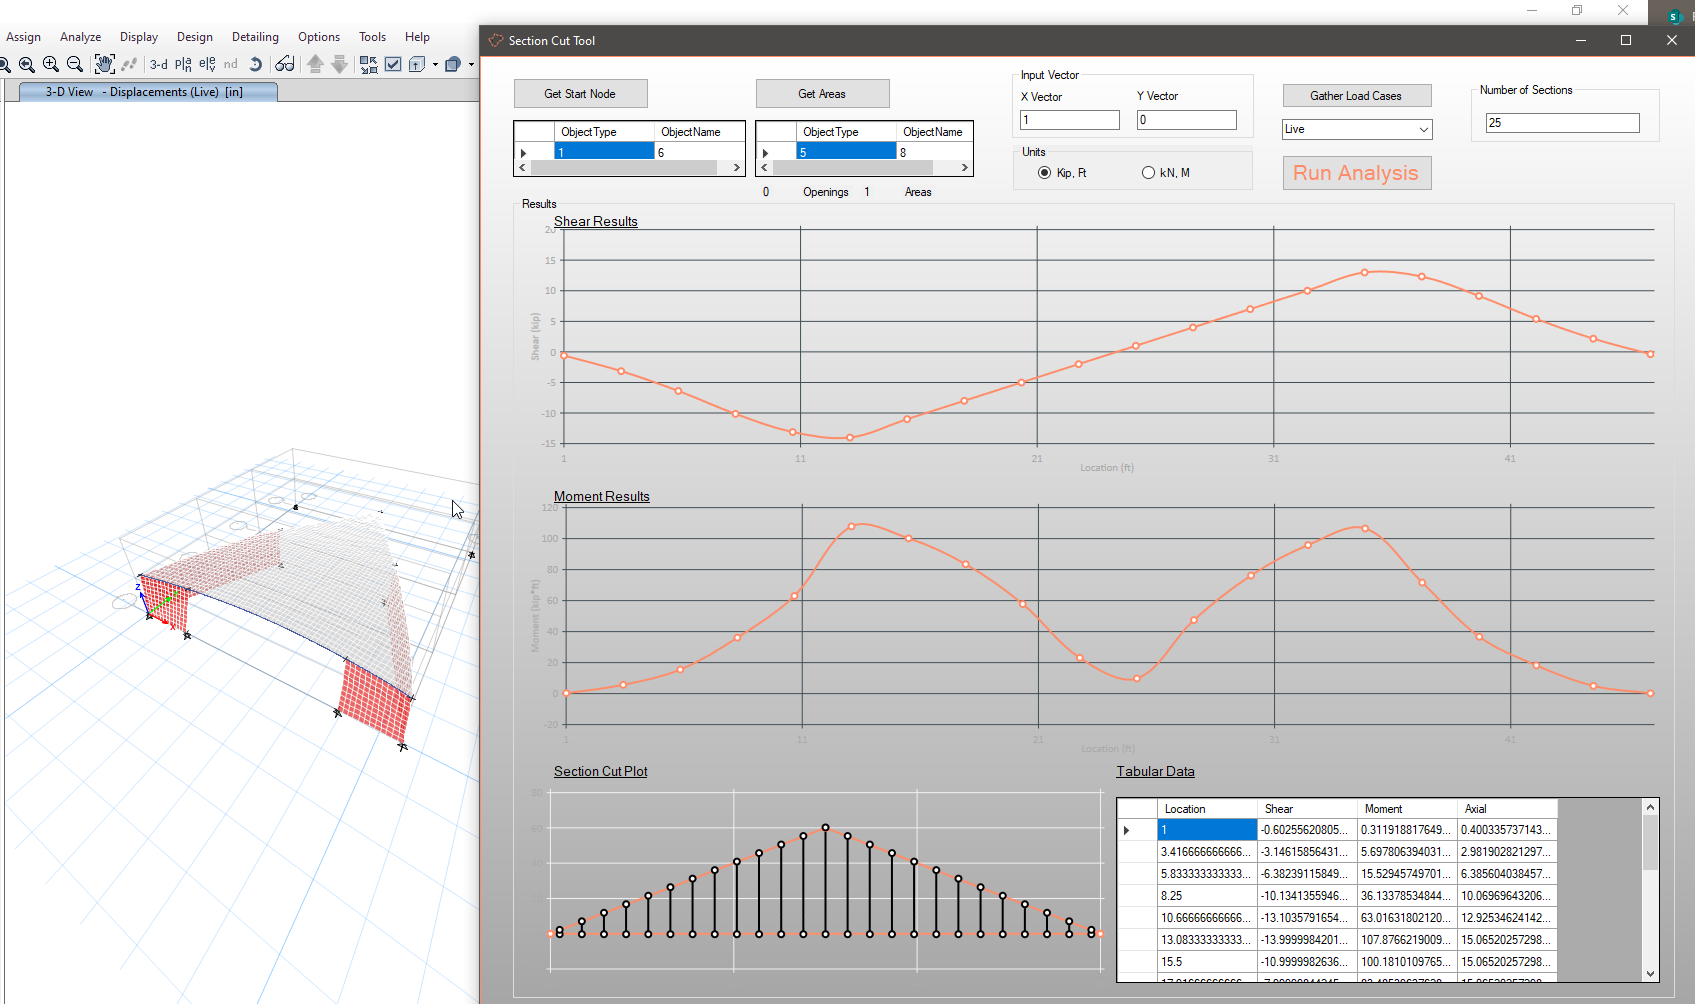
A major upgrade to the section cutter tool, section cuts are now centered on the first and last location where they pass through constituent area geometry. An astute engineer in our office noticed that if the section cuts were not centered on the constituent area geometry, moment results could be quite skewed as ETABs reports moments about the center of the section cut, not the center of the cut geometry. Let's dig into the algorithm and code.
A new github repo has been created for the section cutter tool. This project has become big enough that it deserves it's own repo. The readme page also has install instructions.
The "Smart Sections Algorithm"
The algorithm to make "smart" sections was easy to do on paper, a bit harder to do by painstakingly describing every step to a computer. Let's get some visual aids to assist in outlining the algorithm.
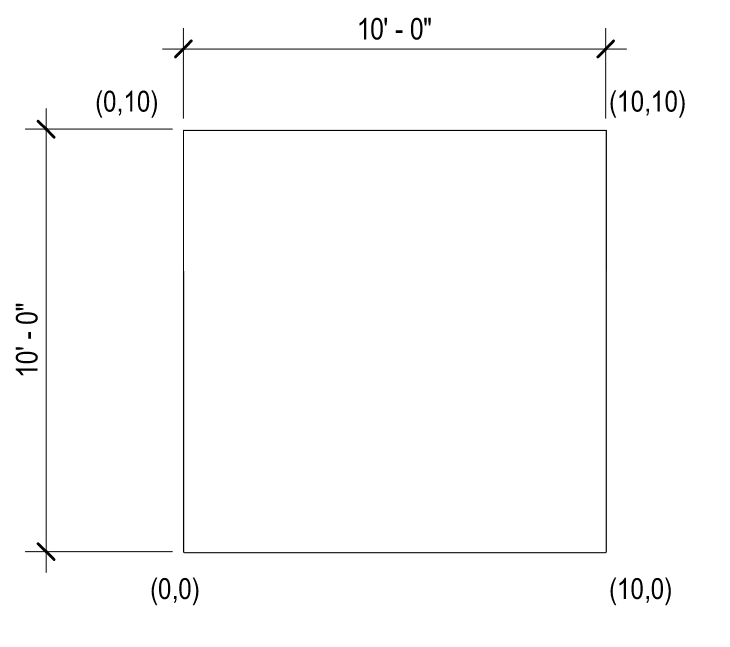
Step 1 - Gather User Areas and Input Node. Example will be a simple square.
Note, I think the input node could be omitted, but it has remained in the section cutter tool for now.
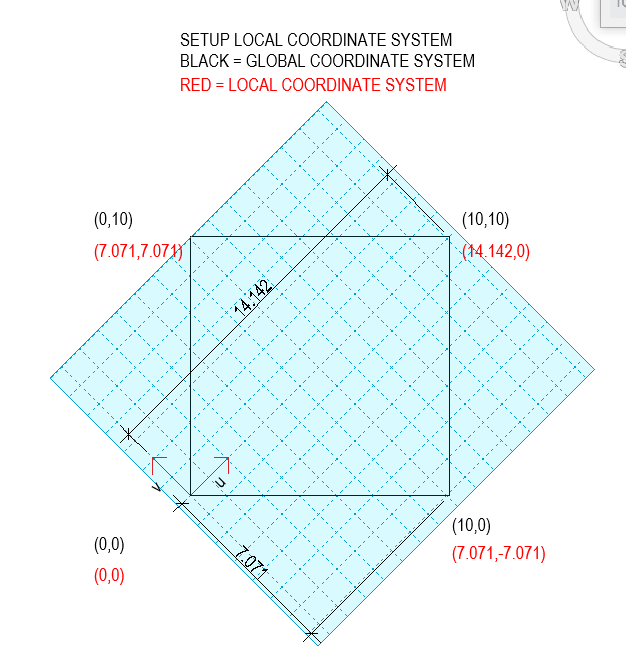
Step 2 - Setup Local Coordinate System (LCS) based on input vector and starting point.
Here the LCS is rotated 45 degrees as shown by the blue rotated grid lines. Convert all constituent area geometry to the LCS. LCS coordinates in Red.
Step 3 - Generate an array lines in the LCS.
The previous section cutter tool would stop at this point. These results would be incorrect for buildings with steps, like an L shaped diaphragm.
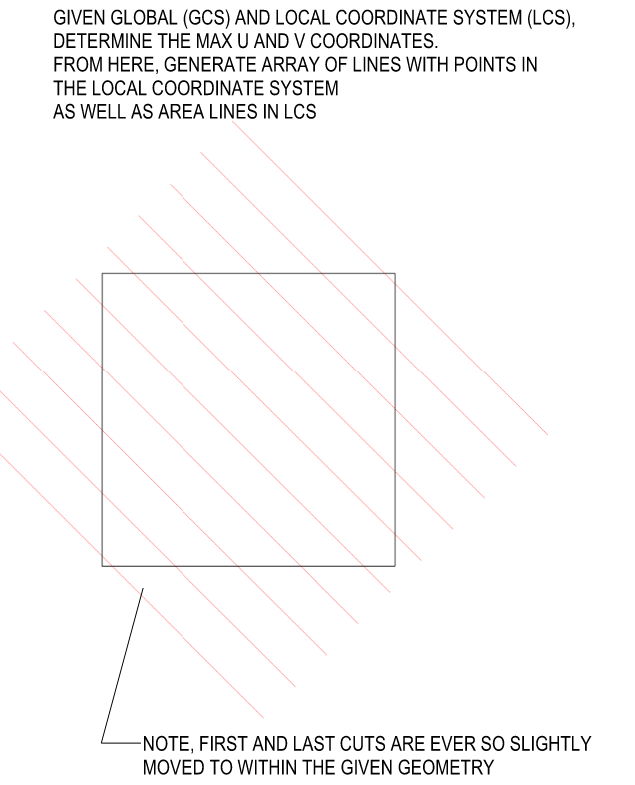
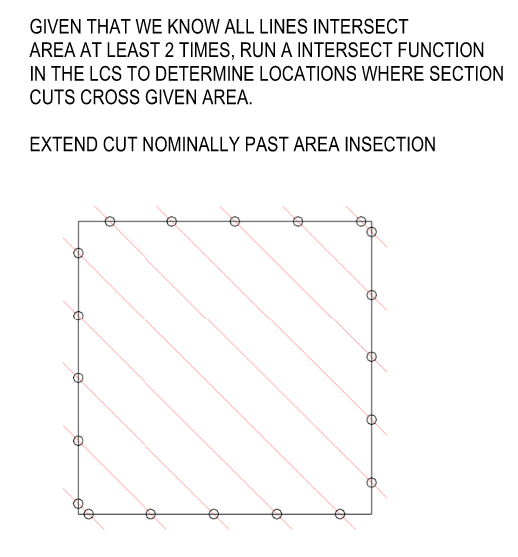
Step 4 - Determine where lines generated in step 3 cross constituent geometry.
Use these points to create the section cuts in ETABs.
The Code
The main struggle on the coding side was controlling all the lists of data and maintaining their structure. The algorithm works for many areas and openings, so the amount of data that gets generated to perform these checks inflates quite quickly. To my surprise, the tool does not seem to struggle with generating all of the section cut data, the slowest part is still the analysis of the semi-rigid diaphragm.
Once again, chatGPT really helped out with the coding. The intersection function was exactly copied and pasted and it worked, how surprising!
Here is my chat with the AI overlord bot, THEY TOOK OUR JOBS! :
Me: Given that two line segments, each with an x and y value, that are known to intersect, write c# code that determines the intersection point, x and y, of the two line segments
ChatGPT
To find the intersection point of two line segments, you can use the concept of parametric equations. Given two line segments defined by their endpoints (x1, y1) to (x2, y2) and (x3, y3) to (x4, y4), you can calculate the intersection point (xi, yi) using C# code as follows:
using System;

class Program
{
    static void Main()
    {
        // Example endpoints of two line segments
        int x1 = 1, y1 = 2;
        int x2 = 4, y2 = 6;
        int x3 = 3, y3 = 1;
        int x4 = 5, y4 = 5;

        // Calculate the intersection point
        if (Intersect(x1, y1, x2, y2, x3, y3, x4, y4, out int xi, out int yi))
        {
            Console.WriteLine($"Intersection Point: ({xi}, {yi})");
        }
        else
        {
            Console.WriteLine("The line segments do not intersect.");
        }
    }

    // Function to check if two line segments intersect and calculate the intersection point
    static bool Intersect(int x1, int y1, int x2, int y2, int x3, int y3, int x4, int y4, out int xi, out int yi)
    {
        // Calculate the denominator for parametric equations
        int denominator = (y4 - y3) * (x2 - x1) - (x4 - x3) * (y2 - y1);

        // Check if the line segments are parallel or coincident
        if (denominator == 0)
        {
            xi = 0;
            yi = 0;
            return false;
        }

        // Calculate the parameters for each line segment
        int ua = ((x4 - x3) * (y1 - y3) - (y4 - y3) * (x1 - x3)) / denominator;
        int ub = ((x2 - x1) * (y1 - y3) - (y2 - y1) * (x1 - x3)) / denominator;

        // Check if the intersection point lies within both line segments
        if (ua >= 0 && ua <= 1 && ub >= 0 && ub <= 1)
        {
            // Calculate the intersection point
            xi = x1 + ua * (x2 - x1);
            yi = y1 + ua * (y2 - y1);
            return true;
        }

        xi = 0;
        yi = 0;
        return false;
    }
}
Replace the example endpoints (x1, y1, x2, y2, x3, y3, x4, y4) with the actual endpoints of your line segments. The code will then calculate the intersection point (xi, yi) if the two line segments intersect, or indicate that they do not intersect.
ChatGPT used an expression "out" that I had never seen before and it was super helpful. I still need to read up on "out" and "ref" in C#, but these seem to be ways to add additional function returns in C#.
Throwing this function into the main portion of the code, I was able to perform step 4 of the algorithm outlined above. Working in the LCS system was nice, allowing for easy manipulations of items that were perpendicular/parallel to the LCS. With the LCS point geometry known, it was easy to convert back into the GCS.
In addition to the main "smart sections" addition, a few features were added
- For Trenno, Imperial (kip, ft), freedom units, and Metric (kN, m), superior units, results.
- Section Cut plot at the bottom of the graphical user interface has been updated to look better.
- A few more data validations items on user input have been added
I have more updates I want to get around to listed on the github repo readme page. If you have suggestions/bugs, please let me know. Looking to make this better.


 I have been working through some complicated diaphragm designs with a newer engineer recently and have been learning a lot about transfer diaphragms. I realized I was falling into some pitfalls and it was good working through this with the newer engineer. One of the great things about working with newer engineers is the fresh perspective and inquisitive nature.


