Deltek is a powerful tool to track all things AEC related. At my level, I use it mostly for project management and tracking project budgets.
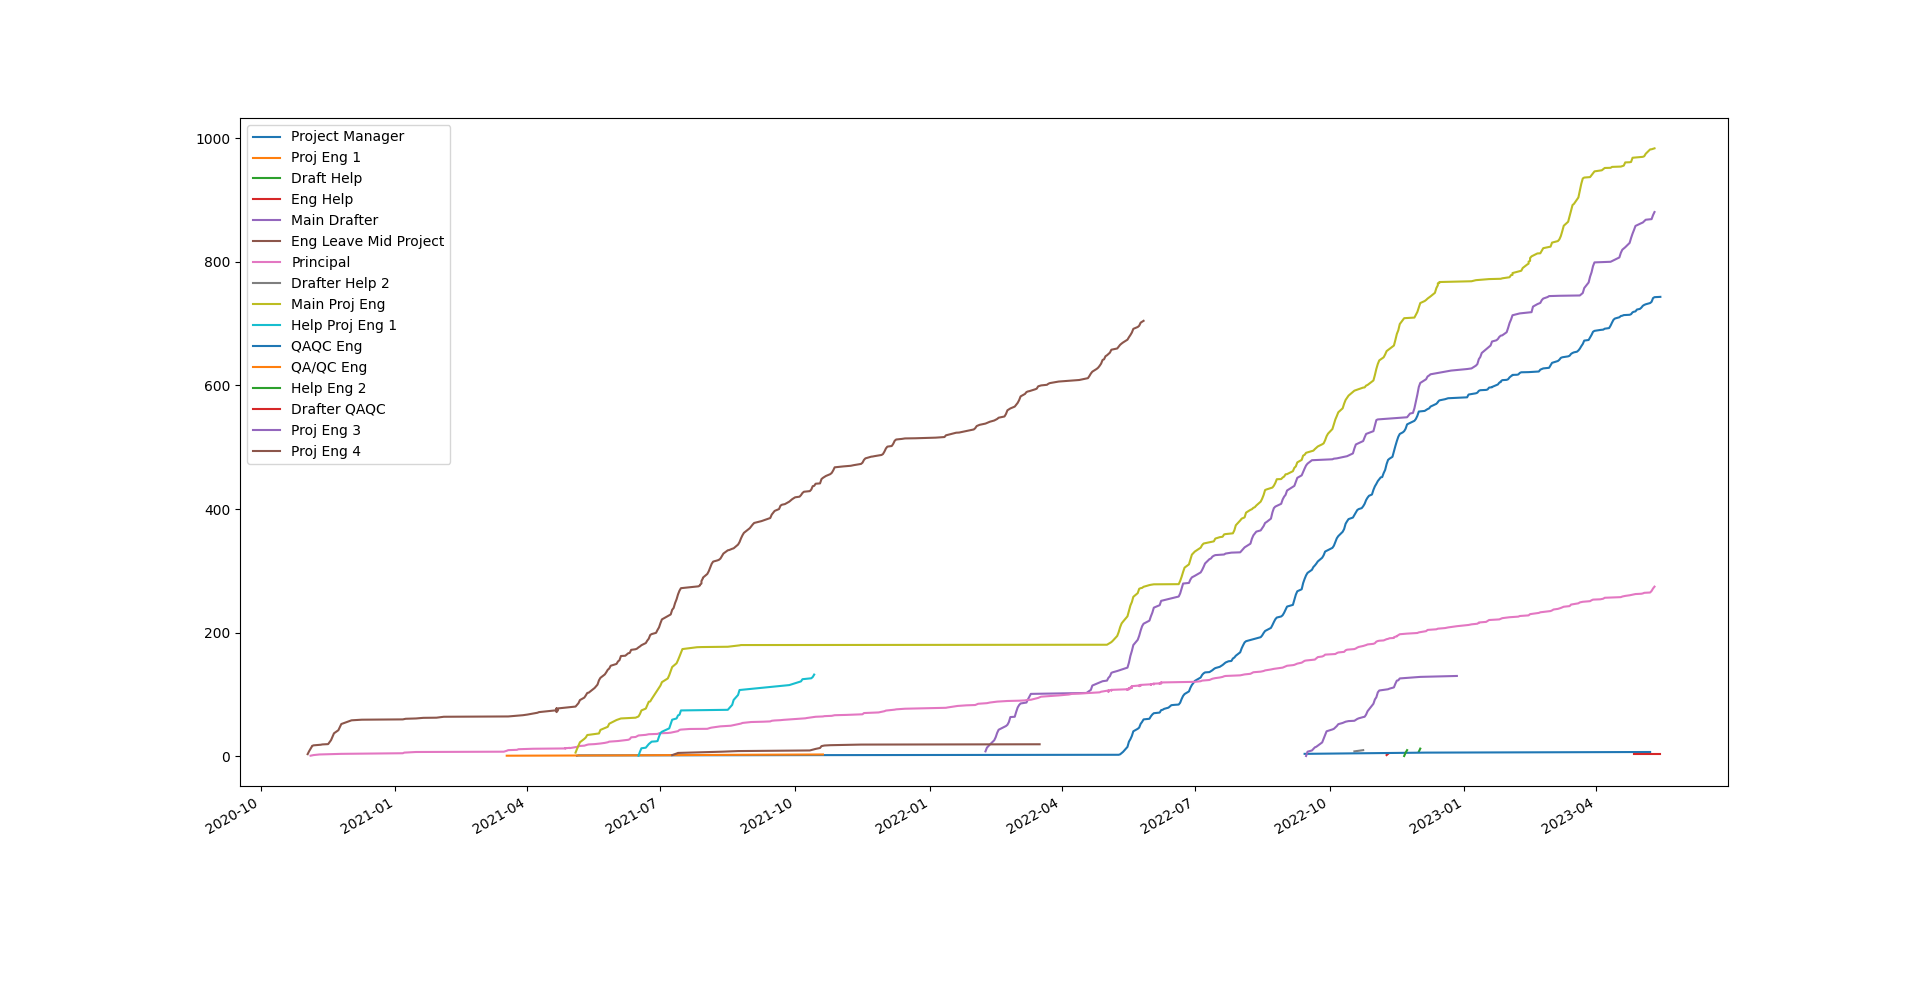 You can get a lot of powerful reports out of it quickly, but at face value, it's just a sea of data. We need to visualize this data to get a better feel for what's happening. The plot above shows hours on a fictitious project over time for differing employees.
Fun notes from fake project, brown engineer leaves company, olive main engineer goes back to school mid project, blue project manager scrambles to pick up the project mid way through.
If you use deltek, you can quickly get this data in an excel format from the project review tab and clicking "export to excel".
The sample excel file will have the following format:
| Person | Date | Hrs | Checked |
| Help Proj Eng 1 | 10/14/2021 | 4 | Checked |
| QAQC Eng | 15 | ||
| QAQC Eng | 9/14/2022 | 4 | Checked |
| QAQC Eng | 12/6/2022 | 2 | Checked |
| QAQC Eng | 5/8/2023 | 1 | Unchecked |
| QA/QC Eng | 5/9/2023 | 6 | Unchecked |
| QA/QC Eng | 5/10/2023 | 2 | Unchecked |
| Help Eng 2 | 10 | ||
| Help Eng 2 | 11/21/2022 | 0.5 | Checked |
| Help Eng 2 | 11/22/2022 | 5.5 | Checked |
| Help Eng 2 | 11/23/2022 | 4 | Checked |
| Drafter QAQC | 4.5 | ||
| Drafter QAQC | 4/27/2023 | 4.5 | Checked |
| Drafter QAQC | 5/15/2023 | 0 | Unchecked |
| Proj Eng 3 | 130 | ||
| Proj Eng 3 | 9/15/2022 | 0.5 | Checked |
With this excel file, we can do a little python on the file, using pandas and matplotlib and create fun plots.
I am still quite a beginner with pandas and I am sure there is a much more elegant way to do the cumulative time vs date plot. I struggled through this, but the code works:
### Multiple Plots

df_all = pd.read_excel('H:\\MyGenericProject.xlsx', sheet_name = 'HoursForProject')
names = df_all.iloc[:,0]

my_column_changes = names.shift() != names
index_change = [i for i, x in enumerate(my_column_changes) if x]

PersonHrs = {}
PersonDate = {}

for i in range(len(index_change)):
    if i == len(index_change)-1:
        print(i)
        PersonHrs[names[index_change[i]+1]] = df_all.iloc[index_change[i]+1:,2]
        PersonDate[names[index_change[i]+1]] = df_all.iloc[index_change[i]+1:,1]

    else: ###grabs the last person in the list
        print(i)
        PersonHrs[names[index_change[i]+1]] = df_all.iloc[index_change[i]+1:index_change[i+1],2]
        PersonDate[names[index_change[i]+1]] = df_all.iloc[index_change[i]+1:index_change[i+1],1]

sum_time = []
for i in PersonHrs.values():
    indiv_sum = []
    indiv_time = 0
    for time in i:
        indiv_time += time
        indiv_sum.append(indiv_time)
    sum_time.append(indiv_sum)

for indiv_person_hrs, indiv_person_date in zip(sum_time, PersonDate.values()):
    DF = pd.DataFrame()
    DF['value'] = indiv_person_hrs

    person_date = pd.to_datetime(indiv_person_date)
    DF = DF.set_index(person_date)

    plt.plot(DF)
    plt.gcf().autofmt_xdate()

plt.legend(PersonDate.keys())
plt.show()
The code to do this and sample excel file is found on github.
In addition, I made a cool stacked bar plot that tracks hours on Engineering, Drafting and QA/QC type work.
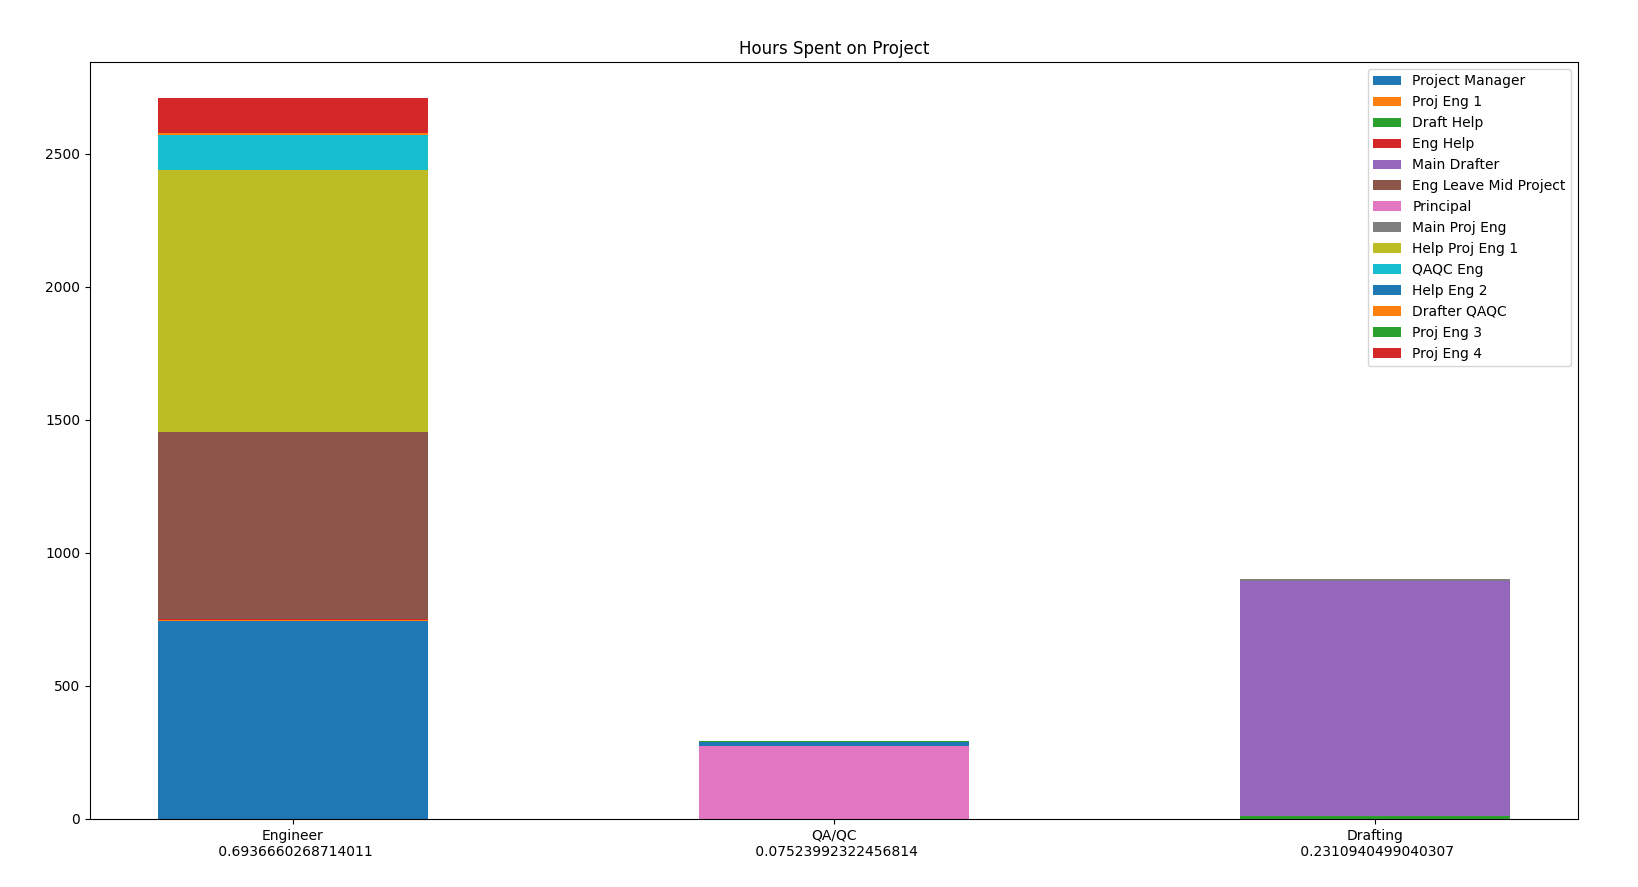
This fake project worked out to be about 70% engineering, 23% drafting and 7% QA/QC.
Moving forward, I would like to access Deltek's API directly. It would be awesome to make these plots directly without having to export excel files and pull other data manually. If you have accessed Deltek's API before, let me know, it would be fun to explore how to do this.