Concrete Design · Reference problem
I-Shaped Special Structural Shear Wall
An spColumn reference example for axial force and bending in an I-shaped reinforced concrete wall.
Saved model
Problem overview
This case compares the saved RETUG concreteJS wall model with StructurePoint’s spColumn control points. The plot shows the supplied 90° analysis: 100 nominal and factored profiles, including both moment directions. The bundled model includes all 16 published control points as demand checks.
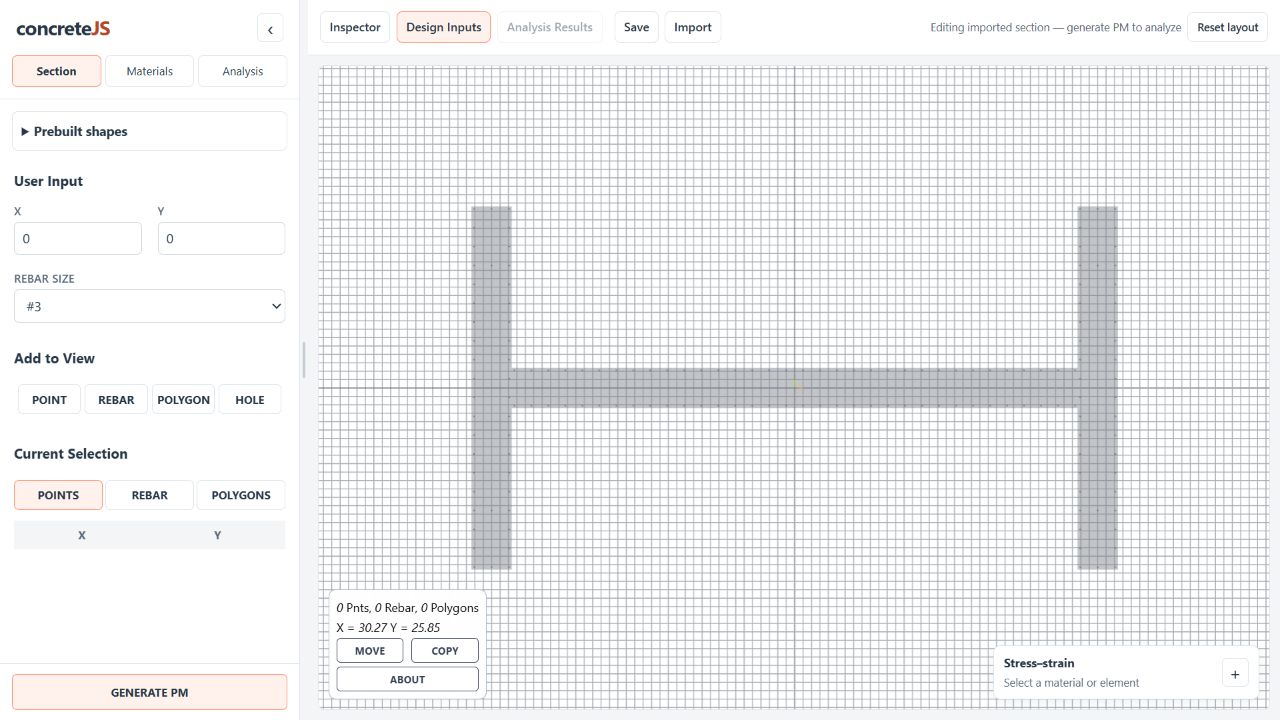
- Section
- 384 × 216 in. overall; 24 in. web and flanges
- Geometry
- Three rectangular concrete regions forming an I-shaped wall
- Reinforcement
- 156 #8 bars in the saved model
- Concrete
- f′c = 6 ksi; saved fc6ksi stress–strain curve
- Steel
- fy = 80 ksi; saved fy80ksi stress–strain curve
- Mesh
- 3 in. edge and interior spacing in the saved model
- Units
- Dimensions in inches, forces in kip, moments in kip-ft
- Saved demand checks
- 16 published control points; compression uses negative P and Y-moment uses M3
Results
Published vs. computed
100 RETUG profiles · 16 published controls
Factored control points are compared below. Compression is positive on this page; the application uses negative P for compression. Published Y-moment maps to M3 = My for this saved model.
Hover over a point for its values. Use the legend to show or hide a series.
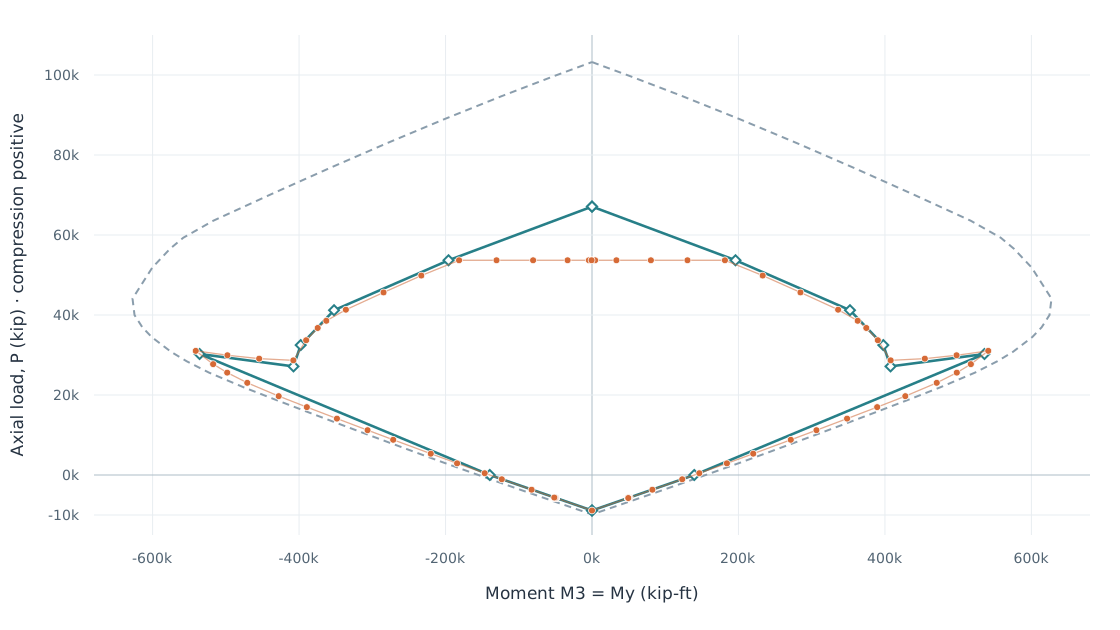
How points are matched. Named steel-control states; linear interpolation between supplied profiles where needed. Pure bending uses φP = 0; allowable compression uses the published φP and the end of the capped branch. Uniform compression retains the application’s 0.80 axial cap.
| Point | Published · spColumn | Computed · RETUG | Difference (%) | |||
|---|---|---|---|---|---|---|
| P kip | M3 kip-ft | P kip | M3 kip-ft | P | M3 | |
| Y: Max. compressionProfile 0 · includes 0.80 axial cap | 67,102.0 | 0.0 | 53,681.6 | 0.0 | 20.0 | — |
| Y: Allowable compressionInterpolated: profiles 6–7 · at published φP | 53,681.6 | 195,926.2 | 53,681.6 | 181,501.7 | 0.0 | 7.4 |
| Y: fs = 0Profile 9 | 41,195.7 | 352,228.3 | 41,323.2 | 336,086.9 | 0.3 | 4.6 |
| Y: fs = 0.5 fyInterpolated: profiles 12–13 | 32,476.9 | 397,760.2 | 33,529.5 | 390,860.7 | 3.2 | 1.7 |
| Y: Balanced pointProfile 13 | 27,151.3 | 407,624.5 | 28,662.4 | 407,809.0 | 5.6 | 0.0 |
| Y: Tension controlProfile 16 | 30,250.3 | 535,871.9 | 31,034.9 | 541,077.5 | 2.6 | 1.0 |
| Y: Pure bendingInterpolated: profiles 27–28 | 0.0 | 139,631.3 | 0.0 | 139,649.4 | — | 0.0 |
| Y: Max. tensionProfile 50 · uniform tension | -8,873.3 | 0.0 | -8,873.3 | 0.0 | 0.0 | — |
| −Y: Max. compressionProfile 0 · includes 0.80 axial cap | 67,102.0 | 0.0 | 53,681.6 | 0.0 | 20.0 | — |
| −Y: Allowable compressionInterpolated: profiles 94–93 · at published φP | 53,681.6 | -195,926.3 | 53,681.6 | -181,501.7 | 0.0 | 7.4 |
| −Y: fs = 0Profile 91 | 41,195.7 | -352,228.3 | 41,323.2 | -336,086.9 | 0.3 | 4.6 |
| −Y: fs = 0.5 fyInterpolated: profiles 88–87 | 32,476.9 | -397,760.2 | 33,529.5 | -390,860.7 | 3.2 | 1.7 |
| −Y: Balanced pointProfile 87 | 27,151.3 | -407,624.4 | 28,662.4 | -407,809.0 | 5.6 | 0.0 |
| −Y: Tension controlProfile 84 | 30,250.3 | -535,871.9 | 31,034.9 | -541,077.5 | 2.6 | 1.0 |
| −Y: Pure bendingInterpolated: profiles 73–72 | 0.0 | -139,630.8 | 0.0 | -139,649.4 | — | 0.0 |
| −Y: Max. tensionProfile 50 · uniform tension | -8,873.3 | 0.0 | -8,873.3 | 0.0 | 0.0 | — |
100 × |RETUG − spColumn| / |spColumn|. A dash means the published component is zero, so a relative percentage is undefined. Small differences may round to 0.0%.
Comparison notes
- P is shown positive in compression to match spColumn. The saved demand cases negate P; M2 = Mx and M3 = My. The 90° curve bends about the model’s Y axis (M3).
- Orange points are the supplied RETUG factored profiles; the dashed gray line is RETUG nominal strength. The teal line only joins the published control points as a visual guide; it is not a reconstructed spColumn design envelope.
- The maximum-compression row compares the displayed RETUG value, including its 0.80 axial cap, with spColumn’s uncapped φP maximum. The resulting 20% difference is a capacity-definition difference. spColumn’s allowable-compression row is the corresponding 0.80 limit.
- Named steel states use the saved curve’s yield strain (0.00207) and the current engine’s tension-control strain (0.00507). The spColumn report uses approximately 0.00276 and 0.00576. These inputs are not identical; the verification does not change them to force agreement.
- The report notes that the increase in axial capacity between balanced and tension control is omitted from its design diagram. The table compares named states, rather than choosing an arbitrary intersection at the same factored axial load.
- Small M2 residuals come from the supplied mesh results. Published moments smaller than 0.1 kip-ft are normalized to zero. Values are based on the 3 in. saved mesh and a 100-profile curve; interpolation and displayed rounding are included.