A long time coming... a professional level plugin for ETABs, or at least a whole lot better than the python diaphragm slicer.
User Input
Results

This plugin will allow you to slice up your diaphragm in any direction you want, allowing you to see shear and moment along the length of the areas.
User Input
Start Point
This is the point at which you want to start the slicing. Only select an individual point, or the program will show you an error message
Areas
Select any number of objects, ensure all selected area objects share the same Z coordinate.
Input Vector
For slicing in the X direction, input X = 1, Y =0, ensure you input a positive integer. Input field will be limited to numbers and at this moment does allow for negative numbers.
Select Load Case
Pressing the Gather Cases button will retrieve all of the load cases in your current project, be sure to select one from the drop down box, this will be the outputted results from the section cut analysis
Number of Section
Input an integer between 2 and 1000, this will be the number of points that populate shear and moment diagrams
After all of these items are input, click on the run analysis button to view the results.
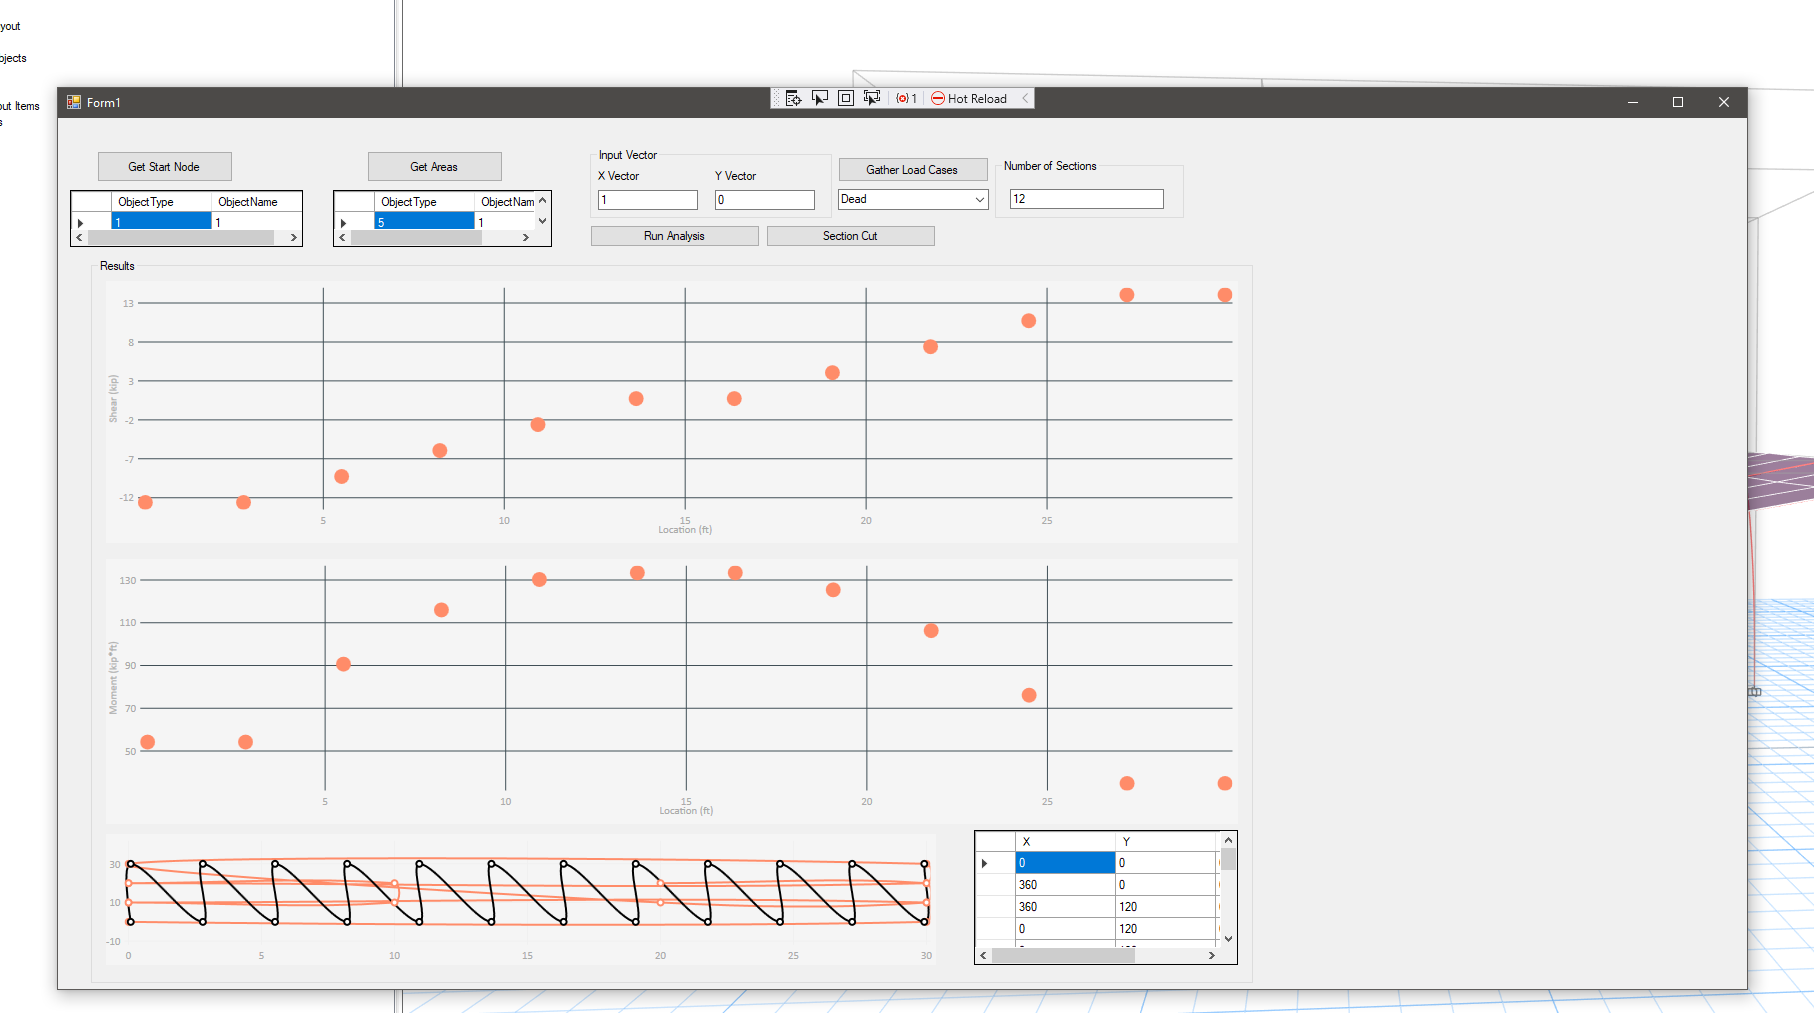
Reviewing the Results
3 Plots will generate after the program has run, shear (kips), moment (kip*ft), and a plot that shows how the program generated the cuts of your diaphragm for QA of your input.
The plots are all hoverable, allowing you to zoom and review results. In addition, a tabular data table is populated with location (ft), shear and moment being available to be copied and pasted in your favorite spreadsheet.
I have posted the code up on github. I hope to get this addin up on CSI's website in the future. If you have done this before, drop a comment below on how to do this.
If you want to take this for test run, let me know below. I have yet to try this out in full production, I am sure there are bugs that need to be worked out.
The Coding
Now that the rough documentation is complete, let's dig into the fun stuff.
First thing that strikes me is that python is still freaking awesome! I was able to do this work in python in 233 lines of code and 1 file. This C# addin weighs in at around 1200 lines and 12 files. That's crazy in my opinion! Python is great for whipping up quick ideas.
Where is the variable explorer in Visual Studio Code?!?
Why in the world is there not a built in variable explorer in visual studio code similar to spyder for python. I never realized how great the variable explorer was until you were reviewing many many lines of nested list/array data. I found myself watching a lot of variables in visual studio code, super slow and tedious.

It looks like there might be a way to view large lists of data in visual studio code with a separate addin, but I did not dig into this in depth.
ETABs API
I ran into some trouble with the API when trying to make section cuts with the database tables methods. I had code that worked in ETABs v19, the OG diaphragm slicer, but the code python code would not work in v20 and the C# code I was trying to write would not work in v20 either. Turns out, the database tables headers between v20 and v19 were updated and no longer matched the visual column headers in the section cut tables. After some painful debugging we got this fixed. You can read more about my struggles here.
Matrices in C#
I use matrices in this program to convert back and forth from global coordinates to local coordinates and needed a matrix program if it was available. After some googling, it looked like mathnet.numerics was the most popular matrix package in C#, even above a c# clone of numpy it appears (package used in python to do matrix math). The mathnet package works, but is a bit clunky and I found the documentation hard to read and understand. Eventually, I was able to create a matrix and invert a matrix. Another odd one, it did not support matrix multiplication, I had to do that by hand!
Some of the weird syntax:
 public class GlobalCoordinateSystem
    {
        public List<double> RefPnt { get; set; }
        public List<double> Vector { get; set; }
        public double hyp { get; set; }
        public double[,] R { get; set; }
        public string inverseMatrixText { get; set; }
        public Matrix<double> R_Matrix { get; set; }
        public double[,] R_Inv { get; set; }
        //This is the constructor, redefine the point?
        public GlobalCoordinateSystem(List<double> xyz, List<double> vector)
        {
            RefPnt = xyz;
            hyp = Math.Sqrt((vector[0] * vector[0] + vector[1] * vector[1]));
            Vector = vector;
            R = new double[,] { { vector[0] / hyp, -vector[1] / hyp, 0 }, { vector[1] / hyp, vector[0] / hyp, 0 }, { 0, 0, 1 } };
            R_Matrix = Matrix<double>.Build.DenseOfArray(R);
            R_Inv = R_Matrix.Inverse().ToArray();
        }
    }
}

        public void glo_to_loc(GlobalCoordinateSystem globalCoords)
        {
            double[] part1 = new double[] { X - globalCoords.RefPnt[0], Y - globalCoords.RefPnt[1], Z - globalCoords.RefPnt[2] };

            //the class will now have new attribute of local coordinates point.LocalCoords[0] = the X local coordinate system
            LocalCoords = new List<double>() { globalCoords.R_Inv[0, 0] * part1[0] + globalCoords.R_Inv[0, 1] * part1[1] + globalCoords.R_Inv[0, 2] * part1[2] ,
            globalCoords.R_Inv[1, 0] * part1[0] + globalCoords.R_Inv[1, 1] * part1[1] + globalCoords.R_Inv[1, 2] * part1[2],
            globalCoords.R_Inv[2, 0] * part1[0] + globalCoords.R_Inv[2, 1] * part1[1] + globalCoords.R_Inv[2, 2] * part1[2]};
        }
        public void loc_to_glo(GlobalCoordinateSystem globalCoords)
        {
            //this is the ref point
            double[] part1 = new double[] { X, Y, Z };

            //the class will now have new attribute of local coordinates point.LocalCoords[0] = the X local coordinate system
            GlobalCoords = new List<double>() { (globalCoords.R[0, 0] * X + globalCoords.R[0, 1] * Y + globalCoords.R[0, 2] * Z) + globalCoords.RefPnt[0],
            (globalCoords.R[1, 0] * X + globalCoords.R[1, 1] * Y + globalCoords.R[1, 2] * Z) + globalCoords.RefPnt[1],
            (globalCoords.R[2, 0] * X + globalCoords.R[2, 1] * Y + globalCoords.R[2, 2] * Z) + 0}; //unsure why this the way to do this. review in the future. should be the line below, without the 0
            //(globalCoords.R[2, 0] * X + globalCoords.R[2, 1] * Y + globalCoords.R[2, 2] * Z) + globalCoords.RefPnt[2]};
        }
Another point, I need to review why my Z coordinate kept messing up in this process.
C# Plotting
I settled on a plotting package called live charts in C#. This package seemed to be the go-to package back in 2018, but it seems like maybe it has stopped being supported by its developers. Again, documentation was kinda hard to find and when it was able to found, it was hard to understand. More struggling and pain to get to the pretty graphs. I do like the graphs are live, zoomable and interactive. The out-of-the-box microsoft graphs had much less of the interactiveability built into them.
UI Development
I went through a few differing versions of UIs and finally called it good enough where it was. My favorite color is orange, so I wanted to through some orange in the plots, hopefully the plots are not too painful on the eyes.
I also set up a linear gradient brush on the background because why not, it seems like most modern UI's are using color gradients.
A few snips of UI in development
A bit too generic, looks like every other windows form
A bit too much orange

Just right, enough flair to know this guy knows what he's doing, but not too visually distracting:

Eventually I want to get back into this and make rounded buttons and pretty up the tabular data, but I wanted to be done with this project and called it quits at good enough.
Coding for the UI was actually pretty enjoyable in C#, there are a lot of good videos out there on how to make your form look good.
This bit of code makes the linear gradient in the background:
private void Form1_Paint(object send, PaintEventArgs e)
        {
            Graphics mgraphics = e.Graphics;
            Pen pen = new Pen(Color.FromArgb(255, 140, 105), 1);
            Rectangle area = new Rectangle(0, 0, this.Width - 1, this.Height - 1);

            System.Drawing.Drawing2D.LinearGradientBrush lGB2 = new System.Drawing.Drawing2D.LinearGradientBrush(area, Color.FromArgb(255, 255, 255), Color.FromArgb(159, 159, 159), LinearGradientMode.Vertical);
            mgraphics.FillRectangle(lGB2, area);
            mgraphics.DrawRectangle(pen, area);
        }
Please take this for a spin and let me know if you have any feedback!
EDIT 04/19/2023:
The section cut tool is only correct slices in the left right direction! (loading in the X global direction typically) I discovered this after using this on a real project.
From ETABs documentation:
How is the plane of the section cut defined when drawn in a 3D view?
Expanded Question: When a section cut is drawn in a 3D view, only the X and Y coordinates are provided. How is the section-cut plane defined?

Answer: When using the Draw > Draw Section Cut command, forces are reported in the section-cut coordinate system which is defined by three axes (1,2,Z) as follows:

Section-cut 1 axis is located within the plane parallel to the global X-Y plane, and rotates counterclockwise from the global X axis according to the user-defined parameter Angle (X to 1).
Section-cut 2 axis is also located within the plane parallel to the global X-Y plane, though it is oriented 90° counterclockwise from the section-cut 1 axis.
Section-cut Z axis is parallel to the global Z axis.
I will need to update the code to pull right combination of either F1 or F2. This should not be too difficult to do.