I have inherited an awesome project through the most unfortunate circumstances, the loss of a great engineer moving onto bigger and brighter pastures.
The project is going to be an ASCE 41 non-linear dynamic analysis and has had geotech engineers involved in picking out ground motion that represent similar ground motions that the faults near this building may produce.
Converting from time history to response spectrum can be done in ETABs, but post processing the data is kinda difficult, I can't seem to find a way to programmatically access the response spectrum curves that ETABs produces.
It's also never a bad day when you have to break out the Chopra Book, so I decided to try to code the process.
The Results
You can find the code to make plots like these on my github:
The required data format is a .txt file that is separated with returns and tabs. I have heard not all geotechs provide their time history data in this manner, so if you want to use this, you may have to edit.
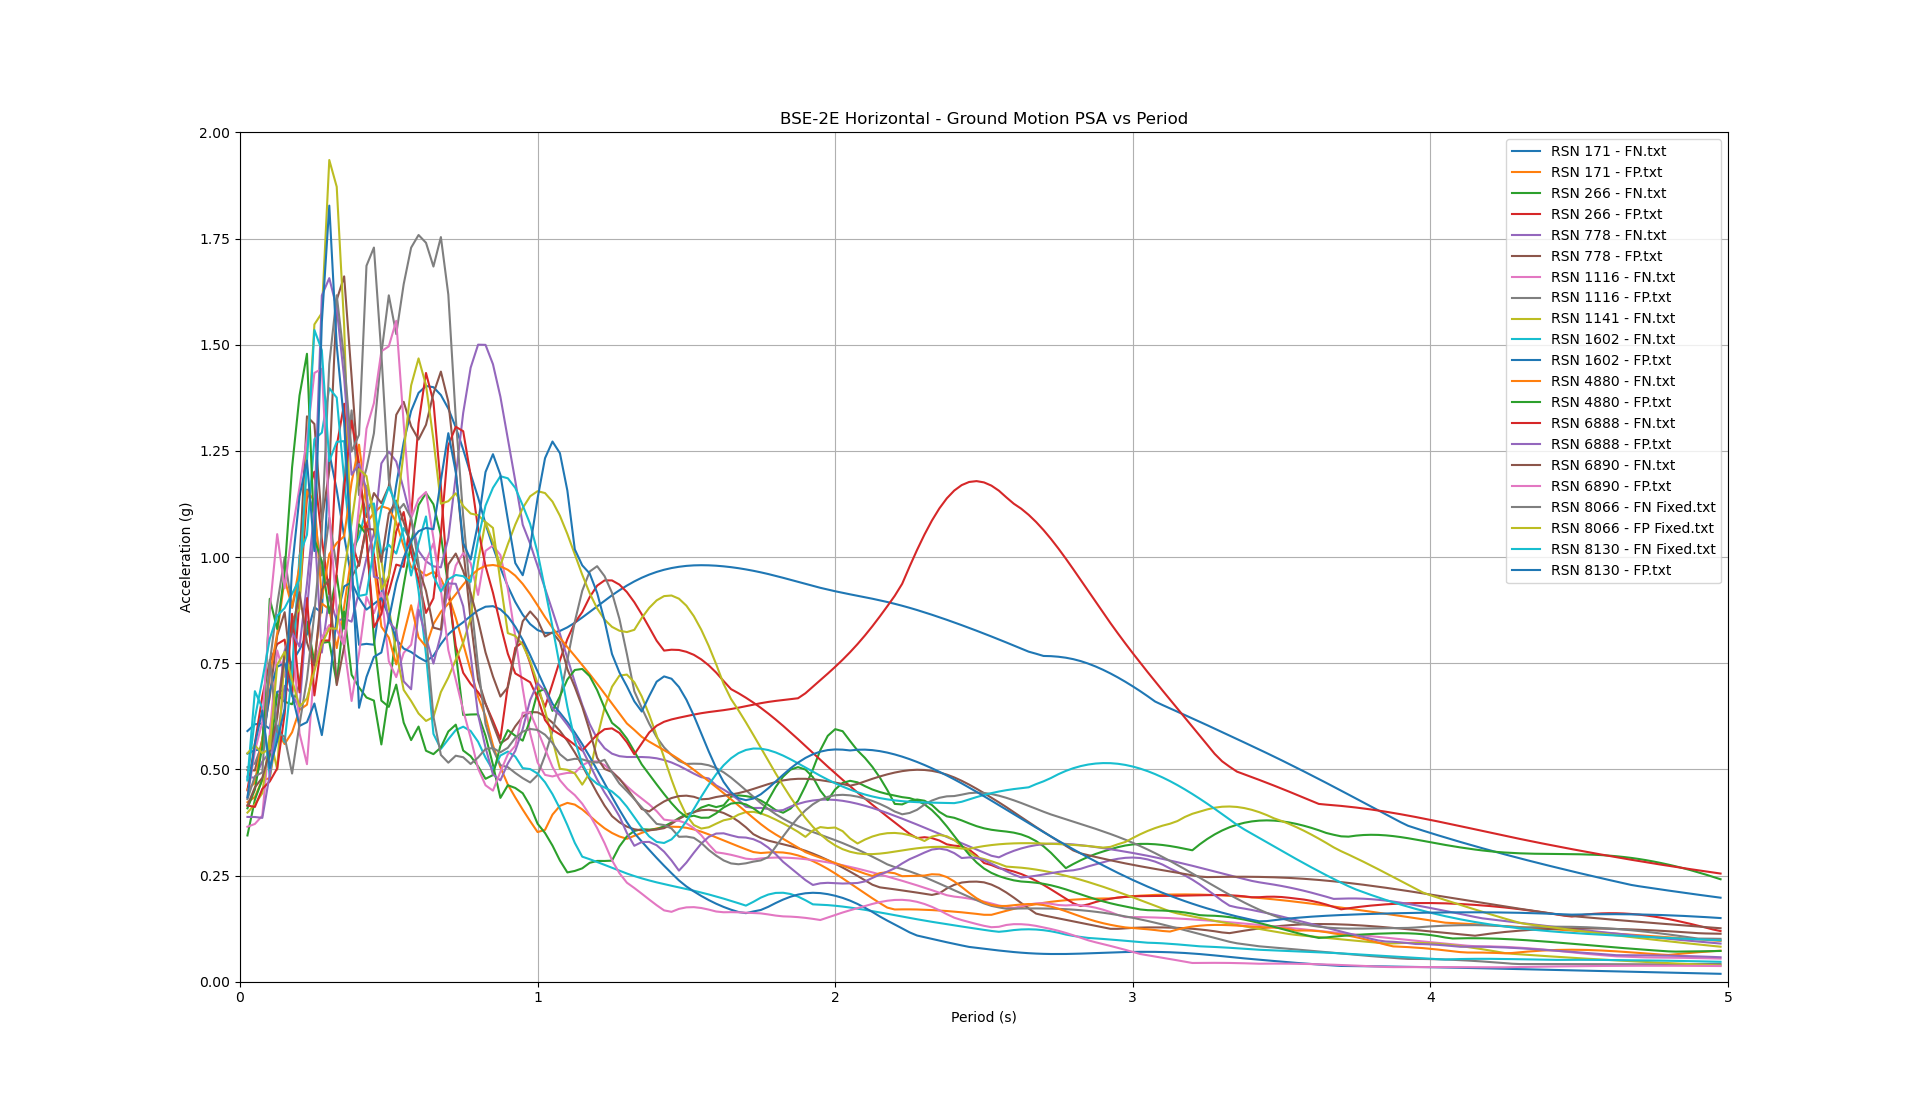
Starting into this, I thought this process involved using fourier transforms to transition from the time domain to the frequency domain, I clearly had forgotten my structural dynamics. Reading chapter 5 of Chopra and getting some guidance from fellow engineer Bryant, I was able to recreate the Newmark method outlined in the Chopra book. Adding a whole bunch of for loops later, some awesome plots popped out.
Comparing the BSE-2E plots (the big, rare earthquakes in ASCE 41) to the code generated response spectrum yielded a ~1.3 increase in peak accelerations at the typical plateau of the response spectrum (time histories were produced high accelerations).
The BSE-1E time history plots were much closer to the code generated BSE-1E response spectrum.